Irina Garskova (Moscow Lomonossov university)
Labour recruiting policy and the Nobel Association of Oil Producers.
A Set of Dbase Language Programs for Studying Social Dynamics
Introduction
This paper presents an approach to data base analysis originally developed in connection with labour history, one which in my view has broader relevance to more general methodological problems of data base creation and analysis. 1
For data about individuals we usually design a data base consisting of several files, according to the original structure of the source, and in this way, create a prosopographical database. The database comprises several files; the main file includes static data on name, date of birth, and so forth. Another files includes data about changes in different attributes, and therefore a single individual's identification number can be found in many records. Such dynamic files are connected with the main file by the key field - identification number.
One approach for moving "from statistics to prosopography" (Verger 1989) begins with creating 'meta-sources' (Genet 1977) in family history, life history, and micro-history (Nygaard 1992; Schofield 1992). Here the most important methodological problems are nominal record linkage and name standardisation. My proposed approach is close to the reverse, "moving from prosopography to statistics", because it is more closely connected to the social history (Garskova 1994: see also Bulst 1990). So, in this case the prosopographical data base is not used for searching out information on individuals (we suppose this work has already been done); it forms the basis of statistical research on aggregated data for particular social, professional, age, national and other groups of individuals. Obviously, separate point corresponding several individuals do not cover any continuous time period, so we have to accumulate a lot of points (corresponding a group of individuals) to cover the interval.
An Example of a prosopographical database
Our example of prosopographical data base is connected with the research of labour market and labour migration, which are very important for understanding Russian history in the period of industrialisation (the end of XIX - the beginning of XX century). At the VIII-th conference, I and Parvin Akhanchi of the Azerbaijan Academy of Science in Baku presented our research on the urban labour market in Baku, a centre of oil production in late imperial Russia. Our work was based on the personnel files of 2000 workers of the "Nobel Association of Oil Producers" (Garskova and Akhanchi 1993; see also Garskova and Akhanchi 1994).
The source included by dynamic and static data for every worker for the entire period of his employment by nationality, literacy, skill-level, age, place of birth, and most important, promotions, pay, and other (including in-kind) benefits, fines, accidents, and so forth. For example, date of birth or nationality are static variables, whereas occupation, level of education, marital or social status, which change over a life course, represent the dynamic data. Depending on circumstances and the time period being examined, a person might change her/his status and belong to different groups.
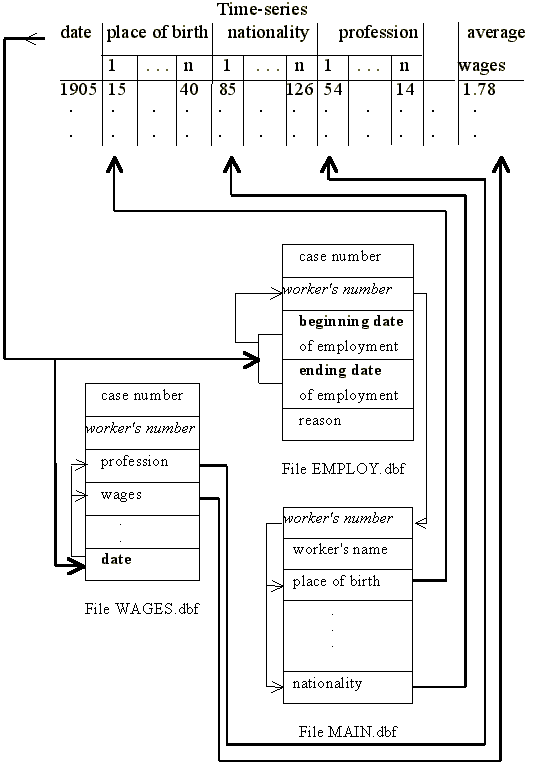
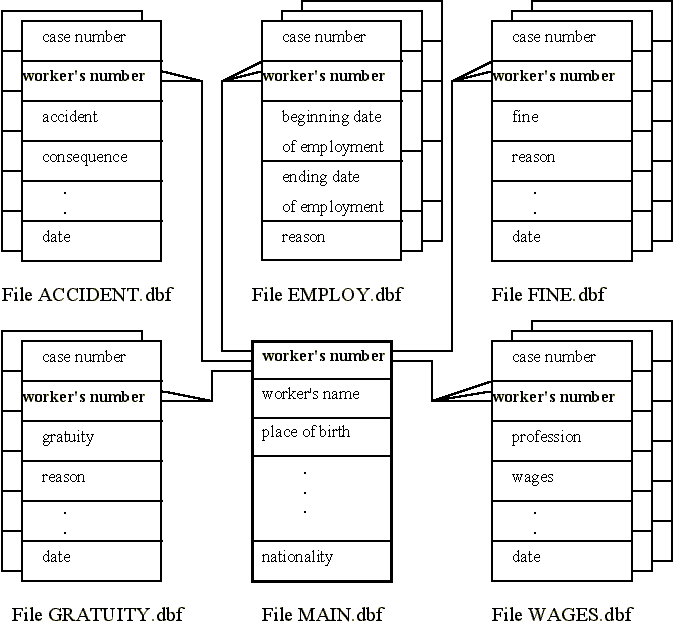
The main peculiarity and complexity of this sort of source is its three-dimensional character: there are cases (workers), variables (workers' attributes) and time (worker's time of employment by the firm). The data base comprises six files; the main one includes static data, the second file includes data about changes in wages and professions, the causes and dates, and therefore a single worker's identification number can be found in many records. A similar structure was designed for the files containing data about transitions in place of work, and about accidents, fines, and so forth (see Appendix 1). It is obvious that numerous records in additional files will correspond to almost each person.
The next peculiarity of the source is its discrete character: during entire time of her employment by the firm a worker could break and then resume her work; so that the period of employment was discrete almost for every worker and she could belong or not belong to a social, national or other group at a given moment depending on her presence on the pay-roll as well as on social, professional, educational, or marital status of the moment. Therefore individuals could not only change groups, but also be present or absent in only one group over the course of time.
So this source can already be treated as a model of 'meta-source': if the firm opened a new personnel file each time a worker resumed his work, we would produce a meta-source similar to our real source by reconstructing the individual's professional career.
A set of dBase language programs
First of all we faced the problem of extracting time series for each variable for each period. Generally speaking, it was necessary to determine a separate list of workers for each year and each month in the period 1878-1921, to count the number of occurrences of each value or class of categorical variables and average values of quantitative variables and then append those figures to appropriate time series. It was necessary to pay attention both to the dynamic and the discrete nature of data in the source and corresponding database.
For this purpose a package of dBASE IV language programs has been created. It is a menu-driven system, using relational database files for a complete database system. The system is designed for transforming data from several data base files to time series for categorical and numerical attributes of workers and any time period. The system works with three files as a minimum: the main file, containing static data (number of records in this file equals number of workers), reference file, containing at least one record for each worker depending on number of intervals of his employment by the firm (each record consists of fields, containing the beginning and ending dates of an interval of working and key field) and some additional files, containing information about dynamical attributes changes and their dates.
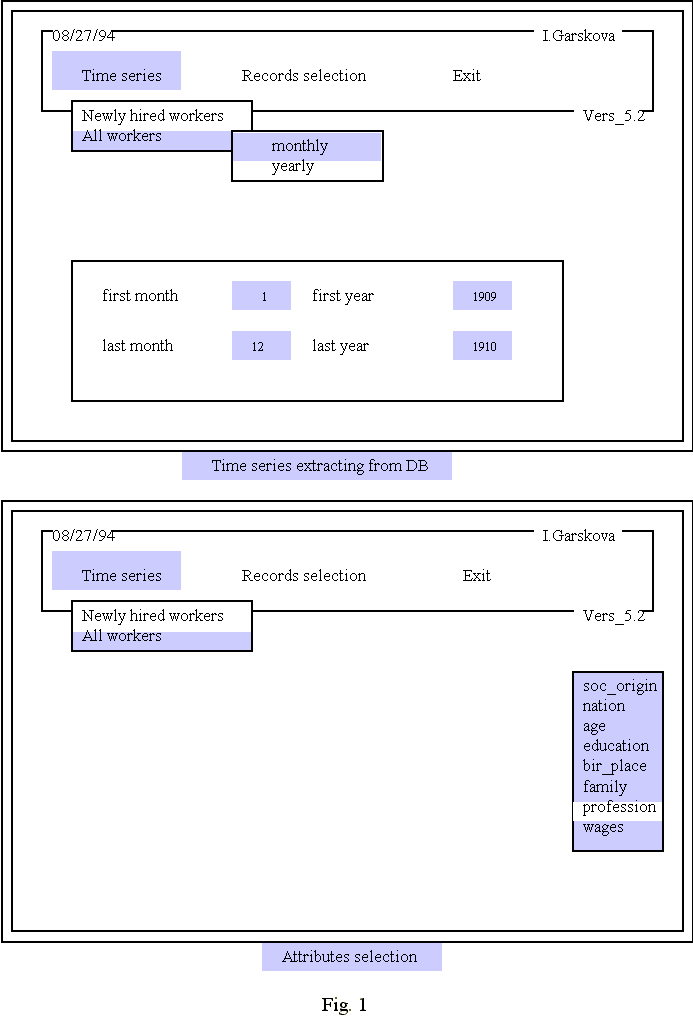
The menu driven system comprises 4 modules: 1) a module for preparing mentioned files, 2) a module for constructing time series (monthly or yearly ordered), 3) a module for selecting from main database file a subset of records being 'covered' by given time period, and 4) a module exporting data to a graphical or statistical package. These 4 modules are pulled together into a menu structure.
Fig. 1a and b show a bar menu for modules 2-3 with popup menus as sub-menus. At this step one can choose between monthly or yearly time series, point out the temporal boundaries of an interval and field/fields that will form appropriate time series. You can see also one very important feature of the system: a choice between constructing time series for all workers or newly hired workers. The second option means that a worker will be included in an appropriate group for given point in time only if he is hired at this point in time (that is, this point is one of the starting points for him, taking into account the discrete character of work); the first option includes a worker if he is continuing to work, have been hired before.
Time series with sophisticated statistical models has been given too little attention by historians. Commonly, historians limit their representation of a development over the course of time to graphics and to a verbal description of the peaks and troughs that catch the eye (Muller 1993). There is, however, a rising interest in the application of time-series models in the field of economic history. I would like to point out two possible types of time series, each having a different nature - time series of attributes of newly hired workers, which is connected with the hiring practice of the firm, are much more stochastic than time series of attributes of all the workers in a firm, which obviously reflects long-run tendencies in the structure of the labour force of the firm.
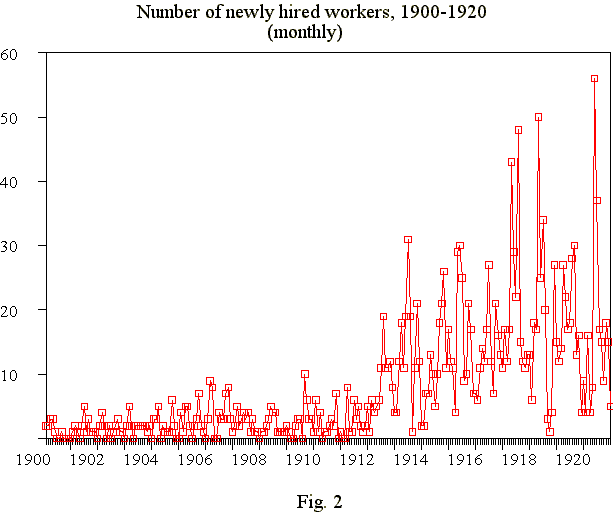
The interest of the researcher determines the choice of a particular type of time series. Time series, representing the hiring practice of the firm, shows trends, a seasonal (usual spring and autumn peaks, summer and winter troughs) component and long cyclical fluctuations, which can vary in regularity. Looking at the time series which are produced by the system (fig.2), one can observe that they have to be smoothed.
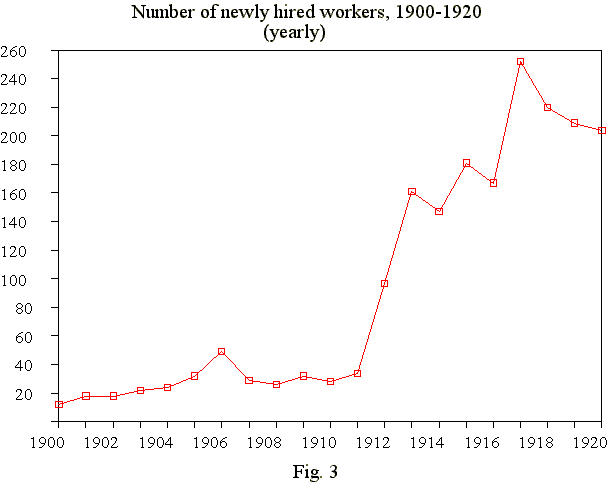
There is a number of ways to solve the problem of smoothing, and the next figure (fig.3) shows the same time series after replacing monthly-organised time series with corresponding yearly-organised series. In any case these smoothed time series enable us to study the hiring practice of the firm and its changes in the course of time.
Of course, some fluctuations in smoothed time series may be caused by external factors, for example, the effects of the economic boom of the period 1910 to 1914 or of World War I; and there would be fluctuations that we could not explain, which we might label 'disturbances' or 'noise', and there are of course other developments in related processes that would influence the time series (immediately or with a 'lag').
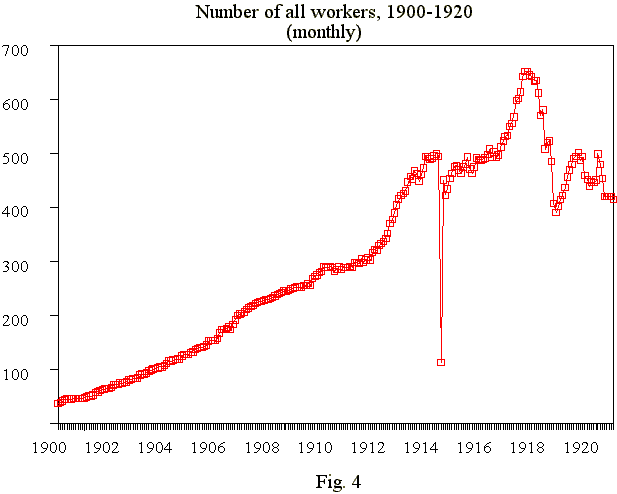
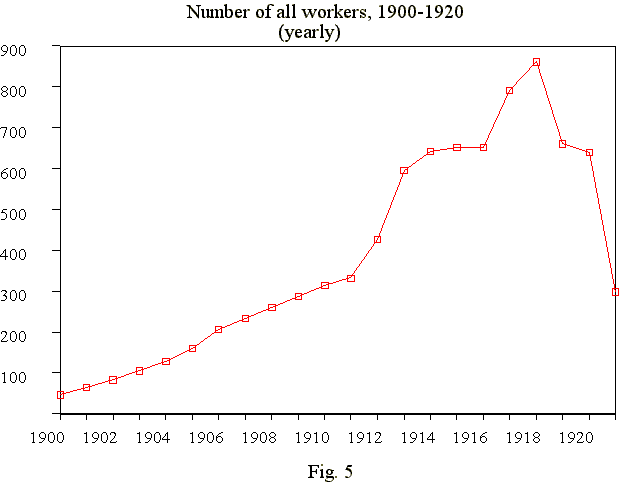
Looking at the fig.4, one might think that the curve is a result of smoothing, but it is in fact an original time series derived not from the newly hired but from all workers who worked in the firm at the relevant times (in this case - months). This figure is very similar to the next one (fig.5), representing yearly organised data.
The surprising smoothness of the curve (fig.4) is understandable, taking into account a certain path dependence or autoregressive element of a series. A phenomenon which occurs at a certain moment in time is often in part explained (at least in statistical sense) by the occurrence of the same phenomenon in the past. An additive effect of such a cumulative curve perpetuates and strengthens the stable character of development. But you can notice one strange point on this graph. At first glance one might associate the phenomenon with an event such as the beginning of WWI, but this association would be wrong, because the point actually corresponds to May 1914. After a careful study of the documents, we would more accurately link the effect to a large strike that took place that month. As a result, about 400 workers were dismissed. Undoubtedly there were a lot of strikes during the time period under consideration (for example, a similar strike went on in 1913, and 360 workers were discharged afterwards), but there is only one outlying point on the graph. My version is: after each strike almost all the discharged workers returned to work, as a rule the same month, therefore the system is not capturing the diminishing number of workers. Only in May of 1914 do we observe a temporal gap between these two events (dismissal and hiring) until June.
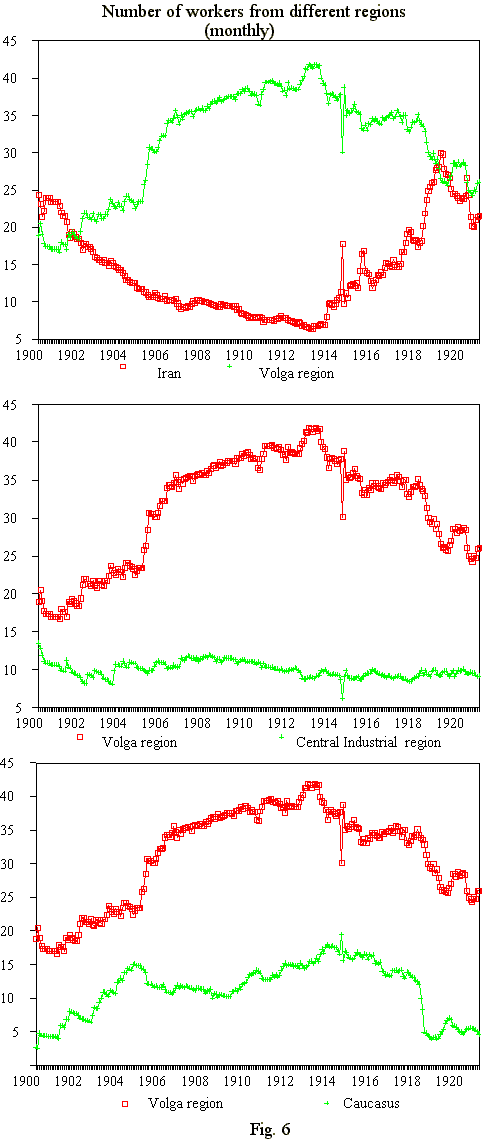
One can notice that a time series of this type, having a great deal of smoothness, that is, representing rather general tendencies, also catches an important local effect. Significantly, we see a combination of long-run and short-run effects on the same graph. So without sophisticated statistical procedures, without shortening of the series, linked with a moving average, the approach gives rather good results. In proof, the next figure (fig.6) demonstrates a time distribution of such variable as place of birth.
The largest group of Nobel Brothers workers was Russians. The portion of Russians in the firm was much higher than in Baku province or in the oil-producing region in general. The other significant uninterrupted influx of workers into Baku was from southern Azerbaijan (Iran). Considering the dynamics of employment one can notice the surprising stability of the main (Russian) portion, while other groups change. At the end of the period one can see the abrupt elevation of the Persian share and the declining shares of Kazan Tatars and Lezghins.
The Russian immigrants to Baku as a rule came from the north: the share of workers from Central Industrial region demonstrates their corresponding stability; Kazan Tatars were originally from Volga region, the Lezghins were from Dagestan (Caucasus) and their shares show the dynamics, opposite to the dynamics for the share of workers from Iran (that is, we notice after 1914 the substitution of Caucasian and Kazan' groups of Moslem workers with the Iran group).
The analysis of relationships, crosstabulation or corrrelation between variables
Time series, because of their aggregated character, don't give an opportunity to reveal the relationships on the level of the individual. To produce cross-tables, a researcher has to return into data base and extract a subset of records corresponding to a given time period with the help of module 3 of the system. Here it is very important to choose an optimal length of a period. Very short time periods would give a chaotic picture, whereas very long periods would give only trivial results.
For example two periods of 1911-1914 and 1915-1918 show very different patterns or dynamics and demonstrate the relationships between the nationality or place of birth, on one hand, and the level of education or skills, on other hand. From the first to the second period, the share of unskilled and illiterate workers in the hiring process increased for the worker from Iran and Azerbaijan (Persians and Iran Tatars) and decreased for all other national and regional groups. Therefore the skilled and literate workers (who had more complicated jobs in machine shops and plants) came mainly from the old industrial centres (for instance, from the central Russian region).
Conclusion
And now, to close, let me suppose that this approach and the corresponding tools may be used to solve general research problems concerned with a much wider range of sources. Any prosopographical database contains dynamic information (Kropac 1989; Selounskaya and Borodkin 1992). If a researcher were inclined to use the data not only for information search and retrieval but for statistical analysis of aggregated time series, she might adopt this approach. One could imagine such sources as biographical data of a parliament members extracted from special reference books, dictionaries, encyclopaedias (especially if these persons were been elected many times after intervals and changed their attributes from one period to the next). One can easily imagine the appropriate sources, documents about those who attended (mainly students or teachers) medieval universities, university matriculation records, General Council records of graduates, marriage and death registries, and the like, which could be adapted for this approach.
1 The investigation was supported by Russian Foundation for Humanities, project N 95-06-17010.
Appendices
Appendix 1. The database scheme References
Bulst, N. (1990), 'Prosopography and the Computer: Problems and Possibilities' in E. Mawdsley, N. Morgan, L. Richmond and R. Trainor (eds), History and Computing III (Manchester University Press).
Garskova, I. (1994), Bazy i Banki Dannykh v Istoriceskikh Issledovaniiakh (Goettingen, St.Katharinen).
Garskova, I. and Akhanchi, P. (1994), 'Discrimination in the Labour Market in the Baku Oil Industry (Late Nineteenth to Early Twentieth Century)', in A. Aganbegyan, O. Bogomolov and M. Kaser (eds), Economics in a Changing World, vol. 1, System Transformation: Eastern and Western Assessments (New York, St.Martin's Press).
Garskova, I. and Akhanchi, P. (1993), 'Geographical and Social Mobility of Labour in the Oil Industry in Baku (late 19th-Early 20th Century)', in G. Jaritz, I.H. Kropac and P. Teibenbacher (eds), The Art of Communication, Abstracts of VIII International AHC-Conference (Graz).
Genet, J.-Ph. (1977), 'Histoire sociale et ordinateur', in L. Fossier, A. Vauchez, C. Violante (eds), Informatique et histoire medievale (Paris).
Kropac, I.H. (1989), 'Who's Who in the Medieval Suitheast of Germany: the Design of the Prosopographical Data Bank at Graz University' in P. Denley, S. Fogelvik and Ch. Harvey (eds), History and Computing II (Manchester University Press).
Muller, A. (1993), 'Migratsia i mobil'nost' v srednie veka: bazy dannykh v izuchenii posetitelei Venskogo universiteta' in L. Borodkin and W. Levermann (eds), Istoriia i Kompiuter: Novyie informatsionnyie Tekhnologii v istoricheskikh issledovaniiakh i obrazovanii (Goettigen, St.Katharinen).
Nygaard, L. (1992), 'Name Standardisation in Record Linking: An Improved Algorithmic Strategy' in History and Computing, vol.4, no.2.
Selounskaya, N. and Borodkin, L. (1992), 'Bazy dannykh "Duma": problemy kompleksirovaniia istochnikov' in Informatsionnyi Bulleten' Assotsiatsii "Istoriia i Kompiuter, no.7 (Dec.).
Schofield, R. (1992), 'Automatic Family Reconstruction' in Historical Methods, vol. 25, no. 2.
Verger, J. (1989), 'Les universites medievales: interet et limites d'une histoire quantitative', in D. Julia and J. Revel (eds) Les universites europeennes du XVIe au XVIIIe siecle: Histoire sociale des populations etudiantes, vol.2 (Paris).
Appendix 2. The extracting of time series from the database files
